This summer was the hottest on record “by a large margin,” according to the EU’s Copernicus Climate Change Service, with a global average temperature of 16.77 degrees Celsius, which is 0.66C above the 1991-2020 average.
“Global temperature records continue to tumble in 2023, with the warmest August following on from the warmest July and June leading to the warmest boreal summer in our data record going back to 1940,” said Samantha Burgess, the service’s deputy director.
In Europe, average summer temperatures were 19.63C, which is 0.83C above average. That led to a record increase of sea surface temperatures, responsible for triggering marine heat waves all over Europe, including in Ireland and the U.K. in June, and in the Mediterranean region in July and August.
Global sea surface temperatures kept rising throughout August, reaching 20.98C, the highest global monthly average on record, Copernicus said. Ocean warming is expected to get worse as El Niño develops in the Pacific Ocean over the rest of the year.
“The scientific evidence is overwhelming — we will continue to see more climate records and more intense and frequent extreme weather events impacting society and ecosystems, until we stop emitting greenhouse gases,” Burgess said.
Typically, sea surface temperatures (SSTs) reach their highest level for the year in March and then begin to fall, before a slight increase again during July and August. Copernicus Climate Change Service data show this year to be atypical in that, after an initial sharp rise in early March and only a slight dip during April and May, global average SSTs have continued to rise to reach the highest value of 21.02°C on 23 and 24 August. This is higher than the previous record of 20.95°C, set in March 2016. In fact, every day from 31 July to 31 August this year has been warmer than the previous record set in March 2016.
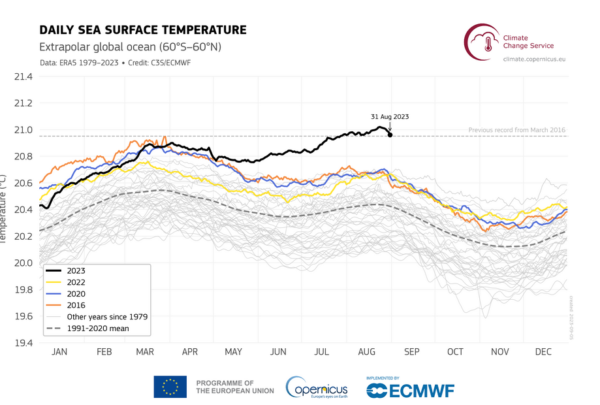
Daily sea surface temperature (°C) averaged over the extrapolar global ocean (60°S-60°N) during 2023 (black line) and for 1979 to 2022 (grey lines). The average conditions for 1991-2020 are shown by the dashed grey line. The previous global average SST record, from March 2016, is shown by the labelled horizontal dashed grey line. Data source: ERA5. Credit: Copernicus Climate Change Service/ECMWF.
To read more click here.